


Abstract
We isolated phytoplankton assemblages from five tropical lakes differing in environmental conditions and incubated them under different extreme growth conditions. Conditions were: under light with nutrient addition (L + N), under light with nutrient and organic carbon addition (L + N + OC), and in the dark with nutrient and organic carbon addition (N + OC). These were intended to simulate phytoplankton succession during early, intermediate and late eutrophication stages, respectively. Decreases in species diversity and richness in N + OC assays from all lakes, except the most eutrophic one, suggested consistent diversity and richness declines during late eutrophication stages. Declines in species diversity were generally caused by a stronger reduction in species richness than evenness, indicating that species exclusion is a more probable response to eutrophication than co-existence and dominance of strong competitors. Under N + OC conditions, the osmotrophic chlorophyte Chlamydomonas was generally dominant, indicating that this flagellate may prevail in late eutrophic communities in the tropical lakes studied. The L + N and L + N + OC assays did not differ from each other in species diversity, but exhibited differences in species composition and richness. This suggests that the changing role of the phytoplankton community in whole-lake matter fluxes during early eutrophication stages could be a more important research question, than predicting the community's diversity response in tropical lakes.
INTRODUCTION
As a result of increasing worldwide urban activities and the transformation of natural areas for agriculture, cultural eutrophication often leads to diversity loss and the dominance of few opportunistic species in freshwater lakes (Smith et al., 2006). During nutrient enrichment and subsequent light limitation, several ecological processes drive changes in lake phytoplankton communities. These processes include bottom-up (Tilman, 1977, 1982) and top-down control (Porter, 1973; Sommer, 1988; Sarnelle, 1993) and interspecific competition (Hutchinson, 1961; Sommer, 1985; Lagus et al., 2004). However, the fate of phytoplankton community composition and diversity is often difficult to predict, as complex community interactions also depend on the original community composition as well as the intensity and frequency of disturbances. Accordingly, chaotic oscillation dynamics is often observed (Huisman et al., 2001; Huisman and Weissing, 2002). Moreover, chaotic dynamics may be established before perturbations by external stimuli are effective, because of the short generation times of small microorganisms (Becks et al., 2005).
In this context, predicting the outcome of biological succession has been an important challenge for limnologists interested in comprehending and mediating the effects of cultural eutrophication. Understanding the ecological mechanisms involved in generating final community composition and diversity requires elucidation of the combined effects of environmental conditions and the physiological abilities of interacting species (Sommer et al., 1986; Tilman, 1990).
According to the resource-based competition theory, changing environmental conditions alter species interactions from competition for nutrients to competition for light as lake eutrophication advances (Tilman, 1982, 1985; Passarge et al., 2006). This occurs because high nutrient levels can support high phytoplankton biomass, and thus high turbidity and light limitation in the water column. Hence, competition for light often plays a more important role in advanced eutrophication stages (Huisman et al., 2004; Hautier et al., 2009). However, the factors involved in the biological succession that follows inorganic nutrient and/or organic carbon enrichment, and subsequent decreases in light availability are still a matter of debate.
The prevalent nutritional strategy of an organism has profound implications for its physiology and biochemical composition and may affect trophic transfer of energy and essential compounds in aquatic food webs (Katechakis et al., 2005; Boëchat et al., 2007). Recent ecological studies have focused on determining the effects of changing environmental conditions on the trophic mode of aquatic protists, in order to predict the consequences of such changes for community diversity patterns and organism spatial distribution (Tittel et al., 2003; Jost et al., 2004; Kamjunke et al., 2004).
The prevailing trophic mode, auto-, hetero- or mixotrophy, seems to be a result of both environmental limitation and species-specific metabolic abilities (Sanders, 1991; Jones, 2000). In temperate acidic mining lakes and deep oligotrophic lakes, as well as in the pelagic oceanic zone, light and/or nutrient limitation are key factors leading to shifts in the main energy and carbon flux pathways among algae and protozoa (Jones et al., 1993; Wollmann et al., 2000; Tittel et al., 2003; Schmidtke et al., 2006). Under such limiting conditions, mixotrophic abilities (combined photosynthesis and phagotrophy and/or osmotrophy) represent an alternative metabolic strategy that results in additional energy uptake and the ecological success of protist species, such as many euglenophytes, chrysophytes and chlamydomonads (Rothhaupt, 1996; Nixdorf et al., 1998; Stoecker, 1998; Schmidtke et al., 2006). Thus, mixotrophic species may outcompete strict auto- and heterotrophs under limiting growth conditions (Rothhaupt, 1996).
Recently, laboratory studies have shown that mixotrophy can also offer energetic and ecological advantages under non-limiting conditions, because synergetic effects arising from the combination of autotrophic and heterotrophic metabolism may outweigh the higher metabolic costs of maintaining both systems (Boëchat et al., 2007). This finding challenges the traditional view that mixotrophy puts an organism at a competitive disadvantage with autotrophs or heterotrophs under non-limiting conditions (Rothhaupt, 1996; Stickney et al., 2000). Consequently, the question arises as to whether the prevalent trophic mode could be a relevant factor driving competition and succession in natural communities under non-limiting resource conditions.
By isolating phytoplankton assemblages of lakes differing in environmental conditions and incubating them under (i) light and nutrient sufficiency (L + N), (ii) light, nutrient sufficiency and organic carbon sufficiency (L + N + OC), and (iii) nutrient and organic carbon sufficiency, but without light (N + OC), we aimed to simulate different eutrophication scenarios in order to identify, respectively, key autotrophic, mixotrophic and heterotrophic players in succession outcomes. This experimental design allowed us to evaluate how different physiological abilities of phytoplankton species may affect succession outcomes as eutrophication advances. We tested the hypothesis that the simulated growth condition will affect physiological abilities differently within natural phytoplankton assemblages and lead to differences in species composition and diversity. Moreover, within the same growth condition, we expected the original assemblage composition to affect the succession outcome.
Specifically, we hypothesized that prevalent heterotrophic nutrition, which may represent late eutrophication stages (simulated in N + OC assays), will force the assemblage towards the strongest changes in composition with only a few dominant opportunistic species and, therefore, a lower final diversity compared with assemblages under growth conditions that may favor autotrophy (simulated in L + N assays) and mixotrophy (simulated in L + N + OC assays). In order to test this hypothesis, we carried out a series of experiments using natural phytoplankton assemblages isolated from five tropical lakes differing in nutrient status and light conditions. The isolated assemblages were inoculated in a nutrient rich medium and kept for 22 days. During the experiments, we quantified changes in phytoplankton species composition and diversity.
METHOD
Sampling and preparation of natural phytoplankton communities
We selected five small tropical lakes in the Federal State of Minas Gerais, Brazil, differing in environmental conditions (Table I): one lake with low light availability (CTAN Lake, whose surface was completely covered by the macrophyte Salvinia sp.), three lakes with low nutrient and high light availability (Casa de Pedra, Azul, and Boa Vista Lakes) and one lake with high nutrient and light availability, receiving untreated sewage discharge (Ferros Lake). We chose lakes with different conditions in order to test the hypothesis that initial community composition may have an effect on the specific outcome of successions, but that a general dominance of osmotrophic species adapted to low light conditions may occur as eutrophication advances. Water samples were collected from each lake at 1.0 m depth with a Van Dorn bottle sampler (5 L volume, Limnotec, São Carlos, Brazil). We measured water temperature, pH, conductivity and dissolved oxygen (DO) concentration and saturation in situ with an YSI 556 MPS multiparameter probe (Yellow Springs Instruments, Yellow Springs, OR, USA) equipped with automatic temperature and barometric pressure compensation and calibrated directly before sampling. Photic zone depth was determined with a 30 cm Secchi disc (Limnotec, São Carlos, Brazil). For nutrient analysis, 100 mL samples were kept in acid-washed plastic bottles and transported to the laboratory on ice. Samples for dissolved inorganic nutrients (nitrate, ammonium and soluble reactive phosphorus) were filtered through GF-F glass fiber filters (45 mm diameter, Whatman) and kept at −18°C until further analyses. Filters containing seston samples were dried at 110°C for 1 h and then incinerated at 550°C for 4 h for particulate organic and inorganic matter determination. Inorganic nutrient concentrations were determined by flow injection analysis (FIAlab 2500, USA) according to standard spectrophotometric methods (APHA, 2006). For taxonomic characterization and quantitative determination of the phytoplankton communities, 250 mL samples were fixed with acetic lugol iodine solution and kept in the dark until counting. Cells were counted using an inverted microscope (Olympus, IX50, Japan) until 100 cells of the most abundant species had been counted (Utermöhl, 1958). Samples for succession experiments (1 L volume) were initially filtered in the field through 45 μm mesh filters in order to remove zooplankton and rapidly transferred to the laboratory. In the laboratory, samples were concentrated by low-pressure filtration onto 5 μm filters and cells were re-suspended in 100 mL axenic WC medium. This step considerably reduced the bacterial density in the inoculum, which then consisted mainly of phytoplankton, but also unicellular cyanobacteria species. The presence of bacteria in the culture flasks, although reduced, may have favored phagotrophic species. However, phagotrophy can be expected to occur in natural phytoplankton assemblages, and thus does not interfere with the objectives of this study. Three subsamples were taken from the concentrate for later determination of inoculated phytoplankton composition and density.
Environmental characteristics of the five small tropical lakes, from which phytoplankton assemblages were isolated for succession experiments
| Casa de Pedra Lake | CTAN Lake (macrophyte dominated) | Azul Lake | Boa Vista Lake | Ferros Lake | |
|---|---|---|---|---|---|
| pH | 8.4A | 6.4B | 8.6A | 5.6C | 5.4C |
| DO (mg L−1) | 8.2A | 3.9B | 8.9A | 7.9A | 8.6A |
| O2 saturation (%) | 115.0A | 45.5B | 116.8A | 85.5C | 96.2C |
| Conductivity (µS cm−1) | 23A | 56B | 105C | 11D | 47B |
| Temperature (°C) | 31.9A | 23.7B | 29.2A | 19.2B | 21.5B |
| Photic zone (m) | 3.2A | 0.18B | 21.0C | 4.8D | 2.3A |
| Nitrate + Nitrite-N (µg L−1) | 19.9A | 26.2B | 52.5C | 25.5B | 574.7D |
| Ammonium-N (µg L−1) | 28.1A | 37.4B | 30.0A | 52.6C | 79.6D |
| SRP (µg L−1) | 7.1A | 2.1B | 7.1A | 9.2C | 14.2D |
| POM (g L−1) | 0.01A | 0.10C | 0.005B | 0.005B | 0.01A |
Same letters indicate no statistical differences (one-way ANOVA followed by Tukey HSD test, P > 0.05).
Succession experiments
For succession experiments, 5.0 mL phytoplankton concentrate was inoculated into culture flasks containing 100 mL axenic WC medium (Guillard and Lorenzen, 1972) adjusted to the ambient pH of each lake in triplicate for each experimental growth condition. A fourth culture flask was inoculated, but no subsample was taken during the experiments. This flask served as a nutrient and DO control, in order to assure that nutrient and DO concentrations were still high at the end of the experiments (>1 mg L−1 PO4-P, >10 mg L−1 NO3-N, and >92% of the initial DO concentration in all assays). The culture flasks were kept at 25 ± 1°C in a 12:12 h light/dark regime (L + N condition, at 52 µmol m−2 s−1 photosynthetic photon flux density), under the same light regime with additional glucose at 50 mg L−1 (L + N + OC condition), and in the dark with additional glucose at 50 mg L−1 (N + OC condition) for 22 days. Experimental flasks were manually shaken twice a day to avoid sedimentation of algal cells. The glucose concentration used resulted in the highest phytoplankton biomass in previous experiments (data not shown). We assumed that the experimental growth conditions selected represent different scenarios of the eutrophication process. Thus, the L + N treatment was assumed to represent the early stages of eutrophication, with high concentrations of inorganic nutrients and light availability favoring autotrophic opportunists, but still low organic carbon concentrations, due to limited decomposition and exudation. The L + N + OC treatment, offering optimal inorganic nutrient and light conditions, but also additional organic carbon, was expected to simulate the second stage of the eutrophication process, favoring a mixotrophic nutritional mode. The N + OC treatment, offering high concentrations of inorganic nutrients and organic carbon, but no light, was performed to simulate stressed assemblages during the late eutrophication stage, with severe light limitation and high saproby, favoring osmotrophic phytoplankton species. We recognize that the growth conditions used simulate the eutrophication process in a highly simplified manner and as extreme endpoints, but such experimental conditions were necessary to provoke rapid phytoplankton assemblage responses to changes in environmental conditions.
During the experiments, we quantified changes in phytoplankton species abundance and assemblage composition by taking three 1.0 mL subsamples each third day. Subsamples taken from the cultures were fixed with Lugol's iodine solution and counted and identified under a Zeiss microscope using a Sedgwick-Rafter chamber. Counting was carried out until 100 cells of the most abundant species had been counted. The Shannon–Wiener index (H′, based on the log2 of cell densities; Shannon and Weaver, 1949) was used to calculate species diversity during the entire experiment for each replicate and trophic condition, as well as for the original lake communities. The Pielou evenness index (J′; Pielou, 1966) was used to calculate assemblage evenness at the end of the experiments in each trophic growth condition and for the lake original community as well.
Statistical treatment
Lake environmental conditions were analyzed for differences using one-way ANOVA followed by Tukey post hoc tests (Zar, 1998). Phytoplankton diversity was compared among trophic growth conditions within each succession experiment using one-way ANOVA followed by Tukey post hoc tests. The same procedure was carried out to compare diversity values within the same growth condition (e.g. L + N) among different lakes. By comparing diversity results for the same growth condition among lakes, we aimed to understand the effect of natural lake original community composition and initial lake environmental conditions on the succession outcome. Student's t-tests were applied to compare initial and final diversity values for a same growth condition. Normality of data distribution and homocedasticity was tested using the Shapiro–Wilk test and Bartlett tests, respectively (Zar, 1998). All univariate statistical procedures were performed in STATISTICA for Windows, version 7.0 (Statsoft, USA).
In order to test for effects of original lake community composition/adaptation and growth condition on succession outcomes, we created a positive difference matrix between the taxon-specific cell density at the beginning and end of the succession experiments. Based on this matrix, we executed analysis of similarity (ANOSIM) using Bray–Curtis dissimilarities between experimental assays and 100 000 iterations with ‘lake’ (the five sampled lakes) and ‘growth condition’ (L + N, L + N + OC, N + OC) as grouping variables. We also performed a non-metric multi-dimensional scaling (NMDS) analysis on Bray–Curtis dissimilarities between experimental assays to visualize the effects on succession outcomes. We used a scree plot and a stress cutoff level of 0.15 to find the parsimonious axis number. Confidence ellipses (95% SD) were drawn for different lakes and growth conditions. ANOSIM and NMDS were performed using the ‘vegan’, ‘ecodist’, ‘BiodiversityR’ and ‘ellipse’ packages in the ‘R’ software (RCoreTeam, 2012).
RESULTS
Environmental conditions and original phytoplankton communities
The five lakes differed in environmental conditions, especially in nutrient concentrations, depths of the photic zone and conductivity (one-way ANOVA, all P < 0.05, n = 15; Table I). Nutrients were highest in the Ferros Lake (Table I), probably due to the untreated sewage discharge in that lake. The Casa de Pedra Lake had the lowest concentration of inorganic nitrogen, whereas the CTAN Lake had the lowest SRP concentrations. The narrowest photic zone was measured in the CTAN Lake due to the presence of the floating macrophyte Salvinia sp., which nearly completely covered the water surface. This lake also had higher concentrations of suspended particulate organic matter (POM) than the other lakes (Table I). The highest conductivity was measured in the Azul Lake, whereas the lowest value was found in the Boa Vista Lake.
The natural phytoplankton community composition also differed among lakes, following differences in environmental conditions. The poor nutrient and light sufficient Casa de Pedra Lake was dominated by Chlorophyceae (Fig. 1), mostly represented by Elakatothrix sp. and Monoraphidium arcuatum. The light-limited CTAN Lake showed an even distribution among taxa, with high relative contributions of Zygnemaphyceae (only represented by Desmidiaceae) and flagellated forms belonging to Euglenophyceae, Chrysophyceae and Cryptophyceae (Fig. 1). The Azul Lake, which had low nutrient concentrations and the highest conductivity and pH values, was dominated by Desmidiaceae of the Cosmarium genus and Chlorophyceae (Fig. 1), mostly represented by Monoraphidium contortum. The Boa Vista Lake, with low nutrient concentrations and the lowest conductivity values, was dominated by Chlorophyceae (Fig. 1), represented by Kirchneriella obesa, Chlamydomonas sp. and Chlorella vulgaris. The high nutrient and light sufficient Ferros Lake was dominated by Desmidiaceae (Fig. 1), mostly represented by Spondylosium panduriforme. The highest Shannon diversity value was found for the light limited CTAN Lake (H′ = 3.14), followed by the low nutrient and light sufficient lakes Boa Vista (H′ = 1.87), Azul (H′ = 1.56) and Casa de Pedra (H′ = 1.35). The nutrient and light sufficient Ferros Lake had the lowest diversity value (H′ = 0.44) (Table II). Species richness and community evenness followed the tendency of diversity, with the exception of the Azul Lake, in which the lowest species richness among all lakes was observed. However, community evenness was high, resulting in a higher diversity value than that of the Ferros Lake, which had both low species richness and community evenness (Table II).
Shannon-Wiener diversity index (H′), species richness (R) and Pielou evenness index (J′) for lake original communities (first value) and experimental assemblages at the end of the succession experiments (second value, mean and standard deviation in parentheses) under different growth conditions (L + N = under light with nutrient addition, L + N + OC = under light with nutrient and organic carbon addition, and N + OC = in the dark with nutrient and organic carbon addition)
| Shannon diversity (H′) | Species richness (R) | Pielou evenness (J′) | |||||||
|---|---|---|---|---|---|---|---|---|---|
| Lake | L + N | L + N + OC | N + OC | L + N | L + N + OC | N + OC | L + N | L + N + OC | N + OC |
| Casa de Pedra | 1.35 2.33A* (0.25) | 1.35 1.88A* (0.54) | 1.35 0.32B* (0.11) | 24 11.3 (3.5) | 24 9.7 (4.6) | 24 5.7 (2.3) | 0.42 0.99 (0.24) | 0.42 0.86 (0.23) | 0.42 0.23 (0.05) |
| CTAN | 3.14 1.80A* (0.34) | 3.14 1.82A* (0.22) | 3.14 1.22B* (0.57) | 41 12.0 (4.6) | 41 17.7 (1.5) | 41 5.3 (1.5) | 0.84 0.74 (0.03) | 0.84 0.63 (0.06) | 0.84 0.76 (0.39) |
| Azul | 1.56 1.99A (0.40) | 1.56 1.40A (1.02) | 1.56 0.37B* (0.27) | 6 7.7 (0.6) | 6 8.3 (1.5) | 6 3.7 (0.6) | 0.87 0.97 (0.07) | 0.87 0.69 (0.55) | 0.87 0.31 (0.27) |
| Boa Vista | 1.87 1.34A (0.35) | 1.87 1.61A (0.25) | 1.87 0.94B* (0.11) | 25 6.7 (1.5) | 25 7.0 (2.0) | 25 2.0 (0.0) | 0.58 0.71 (0.13) | 0.58 0.84 (0.02) | 0.58 1.0 (0.16) |
| Ferros | 0.44 1.92A* (0.20) | 0.44 2.31A* (0.60) | 0.44 1.19B* (0.18) | 10 10.0 (3.6) | 10 13.3 (1.5) | 10 3.0 (0.0) | 0.19 0.88 (0.24) | 0.19 0.89 (0.23) | 0.19 1.0 (0.17) |
One-way ANOVA followed by Tukey HSD test tested for diversity differences among trophic growth conditions at the end of the succession experiments (different letters indicate significant differences, P < 0.05). Student's t-test tested for differences between initial and final diversity values for each trophic growth condition (statistically significant differences are marked with an asterisk, P < 0.05).
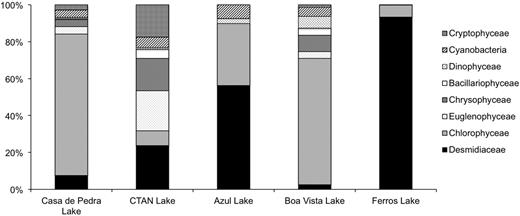
Phytoplankton community composition and relative densities in the studied lakes.
Succession experiments
Although succession dynamics differed in terms of phytoplankton assemblage composition during the experiments (Figs 2–6), L + N and L + N + OC growth conditions generally enabled higher diversity than N + OC conditions during the experiments for all lake assemblages studied (Fig. 7). During all experiments, L + N and L + N + OC conditions resulted in increases in cell abundance towards the end of the experiment, whereas N + OC condition caused an increase in cell abundance in the first week, followed by a decrease towards the end of the experiment (Figs 2–6). Densities of all taxa were generally lower under N + OC growth conditions than under L + N and L + N + OC conditions (Figs 2–6). However, in experiments conducted with assemblages from the nutrient limited Casa de Pedra Lake, Chlamydomonas sp. 1 reached higher peak abundance under N + OC conditions than under L + N and L + N + OC conditions (Fig. 2). In experiments with assemblages from the Casa de Pedra and CTAN lakes, two Cryptomonas species reached the highest densities of all species towards the end of the experiment under both L + N and L + N + OC conditions (Figs 2 and 3). In experiments with assemblages from the CTAN Lake, Cryptomonas erosa dominated the L + N and L + N + OC treatments towards the end of the experiments, while Chlamydomonas sp. 1 dominated the assemblage during the first week under N + OC conditions, still maintaining higher densities than the other species at the end of the experiment (Fig. 3). In experiments with assemblages from the Azul Lake, Chlamydomonas dominated under L + N and L + N + OC conditions. Experimental N + OC conditions resulted in the dominance of the dinoflagellate Peridinium umbonatum, with especially high abundance during the first 2 weeks of the experiment (Fig. 4). In the experiment with assemblages from the Boa Vista Lake, Chlamydomonas sp. 1, Scenedesmus acuminatus and Cryptomonas erosa increased towards the end of the experiment under both L + N and L + N + OC conditions (Fig. 5). Carteria cf. intermedia initially dominated in experiments with assemblages from the Ferros Lake under L + N and L + N + OC conditions, but a decrease was observed towards the end of the experiment (Fig. 6).
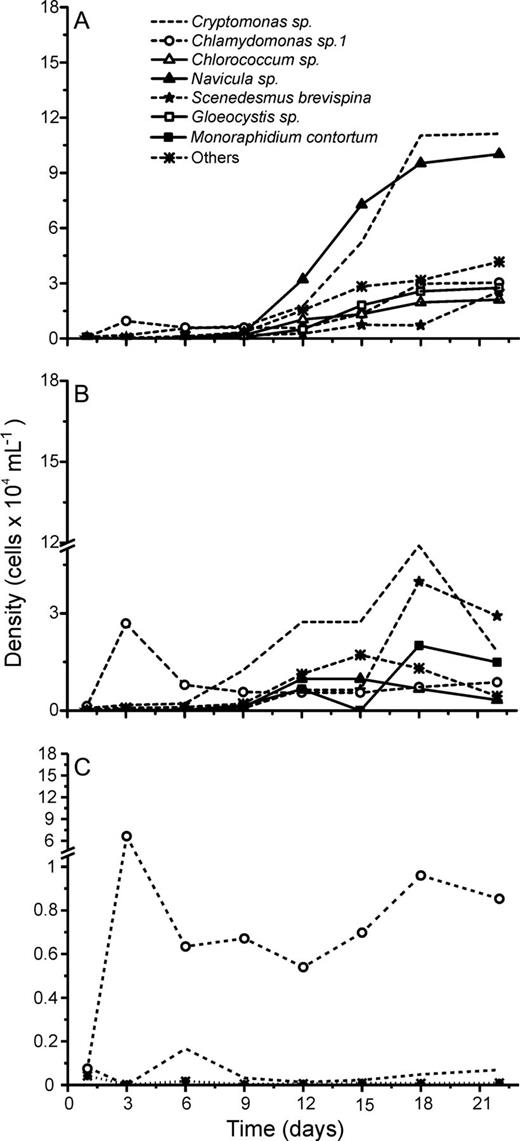
Absolute cell densities during the succession experiments performed with phytoplankton assemblages isolated from the Casa de Pedra Lake under L + N (A), L + N + OC (B) and N + OC (C) culture conditions.
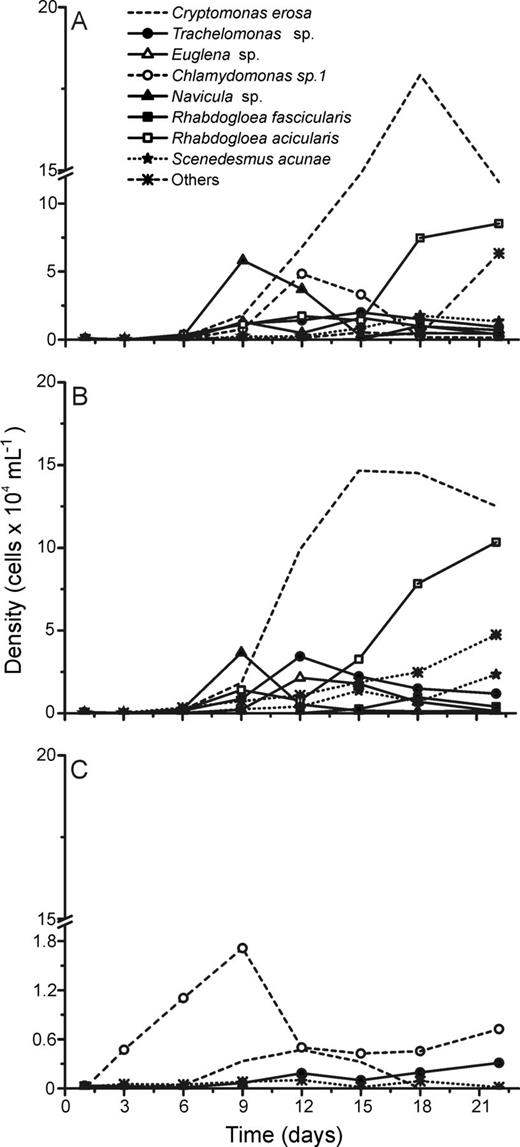
Absolute cell densities during the succession experiments performed with phytoplankton assemblages isolated from the CTAN Lake under L + N (A), L + N + OC (B) and N + OC (C) culture conditions.
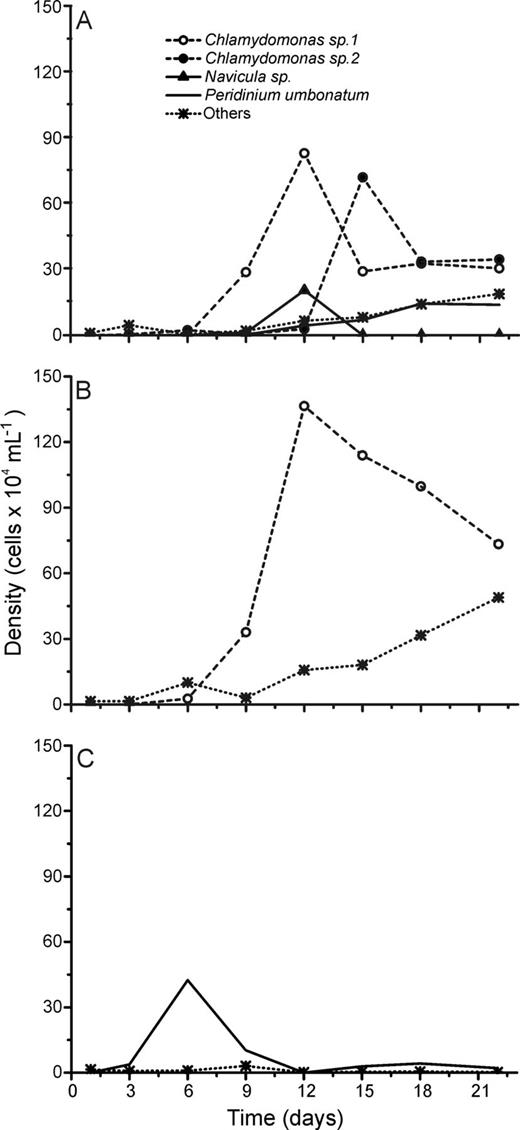
Absolute cell densities during the succession experiments performed with phytoplankton assemblages isolated from the Azul Lake under L + N (A), L + N + OC (B) and N + OC (C) culture conditions.
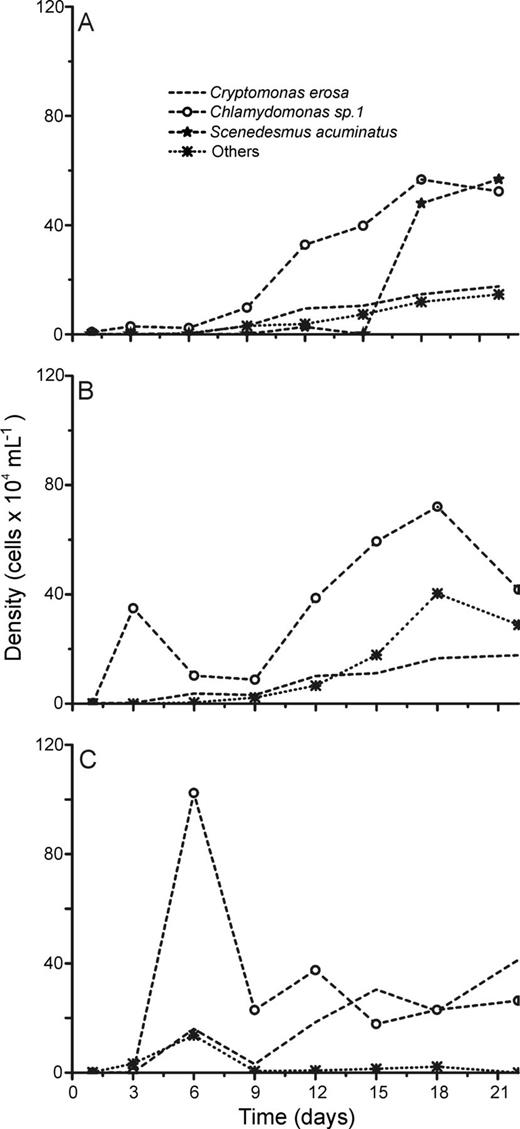
Absolute cell densities during the succession experiments performed with phytoplankton assemblages isolated from the Boa Vista Lake under L + N (A), L + N + OC (B) and N + OC (C) culture conditions.
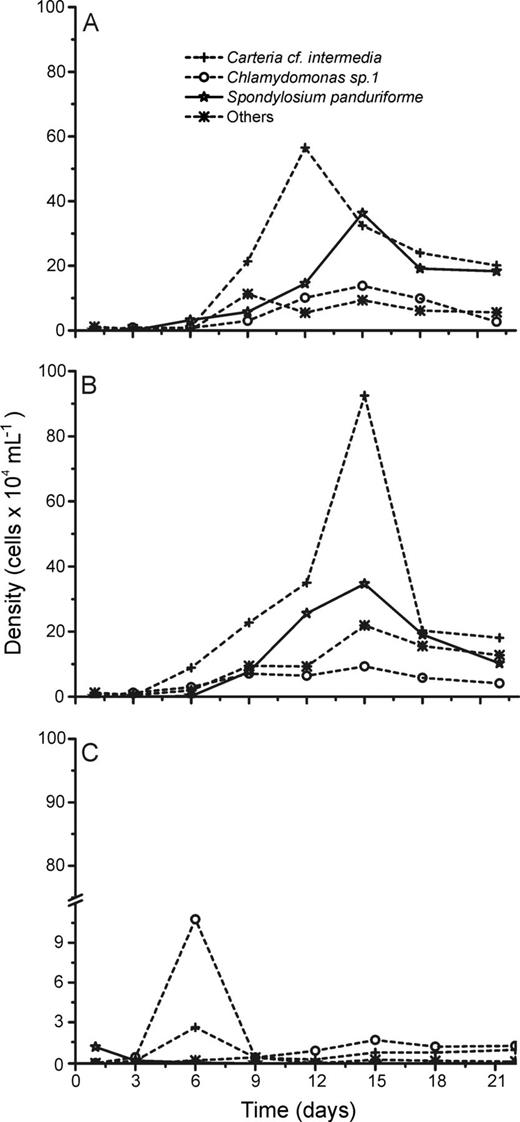
Absolute cell densities during the succession experiments performed with phytoplankton assemblages isolated from the Ferros Lake under L + N (A), L + N + OC (B) and N + OC (C) culture conditions.
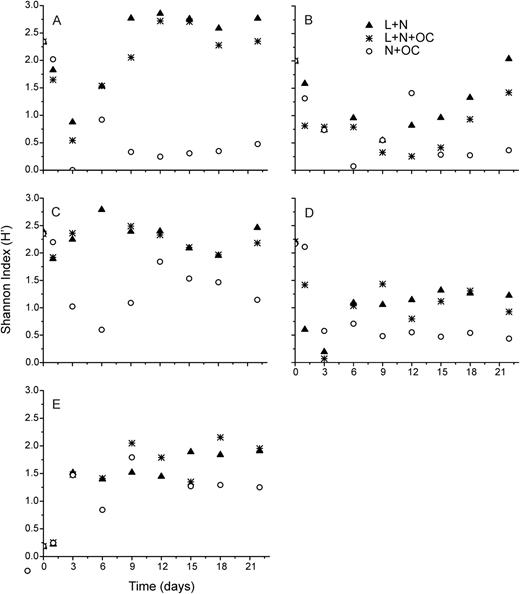
Shannon–Wiener diversity index (H′, based on the log2 of cell densities) during the succession experiments performed with phytoplankton assemblages isolated from the Casa de Pedra Lake (A), Azul Lake (B), CTAN Lake (C), Boa Vista Lake (D) and Ferros Lake (E), under L + N (triangles), L + N + OC (asterisks) and N + OC (open circles) culture conditions.
In general, N + OC growth conditions resulted in the lowest species diversity during the succession experiments (Fig. 7), accompanied by the dominance of Chlamydomonas sp. 1 in four out of five lakes (Figs 2C and 6C). Except for the experiment performed with assemblages from Ferros Lake, diversity tendencies were similar for all experiments, showing a decrease at the beginning of the experiments, followed by an increase from the second week on. Assemblages isolated from all lakes showed lower species diversity at day 22 in experiments run under N + OC growth conditions than those under both L + N and L + N + OC conditions (one-way ANOVA, Tukey HSD test, P < 0.05; Table II). Compared with the initial diversity at day 1 of the experiment, experimental L + N and L + N + OC growth conditions supported similar final diversity in phytoplankton assemblages isolated from both Boa Vista and Azul lakes (Student's t-test, P > 0.05; Table II), but a lower diversity occurred under N + OC conditions (Student's t-test, P < 0.05; Table II) caused by a strong reduction in species richness (Table II). The absence of significant differences in species diversity between day 1 and day 22 under L + N and L + N + OC conditions, observed for experiments with assemblages from the Boa Vista Lake, was due to the fact that a significant reduction in species richness was compensated for by an increase in evenness (Student's t-test, P < 0.05; Table II). For experiments with assemblages from the high nutrient Ferros Lake, all three experimental treatments resulted in higher diversity, due to the higher evenness observed for the experimental communities, compared with that of the original lake community (Student's t-test, P < 0.05; Table II).
Despite the differences observed in diversity and composition patterns during the succession experiments, there was no significant assemblage-wide difference in succession outcomes between different trophic growth conditions (ANOSIM, P > 0.1, R = −0.02). However, there was a significant difference in succession outcomes between assays from different lakes (ANOSIM, P < 0.01, R = 0.39). Non-metric multidimensional scaling extracted two parsimonious axes at a stress level of 0.11 (Fig. 8). Overlapping confidence ellipses also indicated no differences in assemblage-wide succession outcomes between different growth conditions (Fig. 8A). However, non-overlapping confidence ellipses pointed to differences in succession outcomes between assays from the eutrophic Ferros Lake on the one hand, and the more oligotrophic lakes CTAN, Casa de Pedra and Boa Vista on the other hand (Fig. 8B).
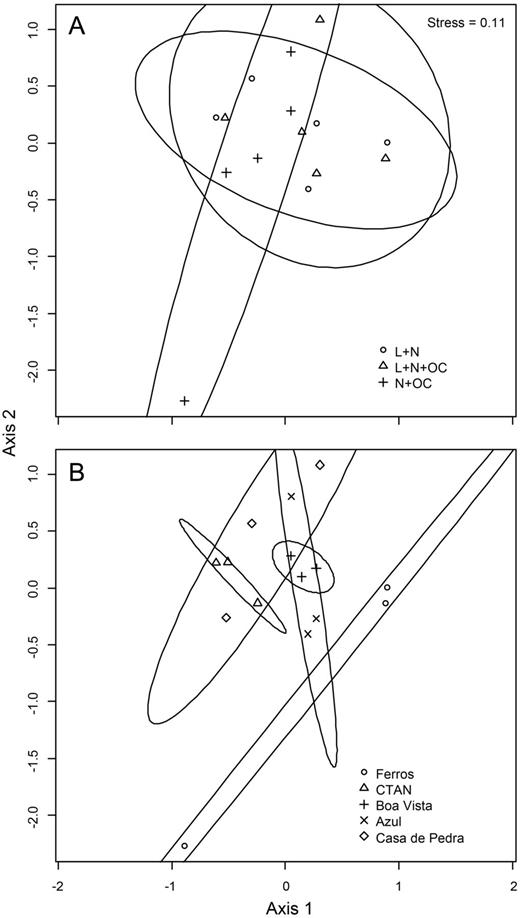
Non-linear multi-dimensional scaling results of succession outcomes and 95% SD confidence ellipses for different growth conditions (A) and lakes (B).
DISCUSSION
In our study, we tested for responses of natural phytoplankton assemblages to different non-nutrient-limiting conditions, designed to select species more adapted to autotrophic, mixotrophic and heterotrophic growth, in order to simulate responses occurring at early, intermediate and late stages of eutrophication, respectively. The assays performed, differing in light and organic carbon availability, are certainly extreme simplifications of temporally and spatially dynamic eutrophication processes occurring in lakes, and the N + OC assay performed in the dark represents an extreme stress situation. However, studying the effects of extreme differences in growth conditions on succession outcomes may give valuable insights into potential eutrophication responses related to species-specific metabolic abilities.
The nutritional strategy of plankton protists affects their physiology and ability to compete for limited resources (Sleigh, 2000). In aquatic ecosystems, phytoplankton communities can be simultaneously limited by nutrients, light, organic carbon and temperature, besides being affected by other factors, such as grazing, flushing, pH and conductivity. This co-limitation may result in coexistence and high diversity but may also generate non-equilibrium community composition, depending on the physiological abilities of the competing species (Brauer et al., 2012). Although the eutrophic state of lakes does not necessarily implicate low diversity, the substitution of species with progressing eutrophication may result in the dominance of species well adapted to low light, leading to decreases in community diversity in both, temperate (Sommer, 1988, 1991) and tropical lakes (Figueredo and Giani, 2001). Thus, the physiological abilities of species may influence and modulate successions in such changing systems.
Communities may respond to severe eutrophication with decreases in community diversity (i) due to lower richness and/or (ii) due to lower evenness, caused by the dominance of opportunistic species (Huszar et al., 1998; Figueredo and Giani, 2001). In the Shannon–Wiener index, species richness can indeed exert an effect on diversity in communities with a richness of less than 15 species (Sager and Hasler, 1969). Interestingly, lower species diversity observed at the end of our experiments with phytoplankton assemblages isolated from four out of five lakes was generally caused by a much stronger reduction in species richness than in assemblage evenness. This result suggests that species exclusion can occur as a response to eutrophication, rather than co-existence and dominance of strong competitors. This pattern was especially obvious in experiments conducted under N + OC conditions, which were assumed to represent a more advanced eutrophication scenario. However, the N + OC treatment was the most extreme treatment in our experimental setup, and advanced eutrophication stages would be better represented by low light conditions, rather than no light at all. Such a low light treatment could result in different assemblages, however, probably with a co-dominance of osmotrophic flagellated and cyanobacteria species (Sommer, 1988; Calijuri et al., 2002).
Chlamydomonas sp. 1 was the dominant taxon under experimental N + OC conditions in all experiments, except for those with isolates from Azul Lake, in which only Chlamydomonas sp. 2 occurred in very low densities in the natural phytoplankton community. This success of Chlamydomonas sp. 1 in N + OC treatments suggests a high adaptation of this taxon under severe light limitation and high dissolved organic matter conditions, characteristic of shallow lake systems in advanced eutrophication stages. This result corroborates previous findings that osmotrophy, i.e. the use of dissolved organic carbon, is the most successful strategy adopted by different Chlamydomonas species under light limitation (Lalibertè and Noüie, 1993; Tittel et al., 2005). Interestingly, the Chlamydomonas species investigated grew well on glucose, which is not common for this genus (Droop, 1974). Moreover, Chlamydomonas, as well as other osmotrophic flagellates belonging to Cryptophytes and Euglenophytes, were abundant in the most light limited and POM rich lake in our study (CTAN Lake), as well as in other hypereutrophic systems in the region investigated (Figueredo and Giani, 2001).
In contrast to all other experiments in our study, diversity increased during the experiments carried out for the Ferros Lake, the most eutrophic of the lakes studied, compared with the original lake community. As predators had been removed from the assays, the lower diversity observed in the natural community could suggest a strong top-down control by herbivores in this lake. Top-down control is known as an important mechanism of phytoplankton succession in shallow eutrophic lakes (Sommer et al., 1986; Sarnelle, 1993) and could be an important regulator of the natural phytoplankton community in Ferros Lake, in which high densities of Copepoda, Cladocera and Rotifera are present (personal observation). Moreover, predation can also modulate phytoplankton competition outcomes in controlled laboratory studies (Sommer, 1989). In order to test the hypothesis that physiological abilities of species can affect succession outcomes of phytoplankton assemblages in experimental eutrophication scenarios, we had to remove the influence of predators. Otherwise, we would not have been able to separate both effects. However, the removal of predators from experimental treatments limits the extrapolation of results in terms of final community composition in the lakes studied.
Despite clear differences in succession outcomes between different experimental conditions in terms of absolute phytoplankton abundance, diversity and species richness, multivariate ANOSIM and NMDS analyses did not indicate that this was a consistent assemblage-wide difference across lakes. Nonetheless, these analyses showed significant assemblage-wide differences in succession outcomes between the eutrophic Ferros Lake and several oligotrophic lakes across different conditions. This points to the importance of initial assemblage composition and perhaps also the species' physiological adaptation in determining successional responses to eutrophication. The fact that Chlamydomonas sp. 1 dominated four out of five assemblages under N + OC growth conditions, regardless of original lake conditions or initial assemblage composition, suggests a strong effect of phytoplankton physiological abilities in determining assemblage composition and diversity during advanced stages of eutrophication. These results correspond well with findings from eutrophic Sicilian lakes, in which Chlamydomonas species were strong bloom-forming competitors (Naselli-Flores and Barone, 2000). The absence of light, as simulated by N + OC growth conditions, resulted in lower diversity in phytoplankton assemblages from all lakes, except for those from eutrophic Ferros Lake. This finding may support the view that light limitation drives changes in community composition towards later stages of eutrophication. However, the experimental dark condition in our study was extreme and does not necessarily represent the reality of later eutrophication stages. Interestingly, the most light-limited lake in our study, CTAN Lake, had the highest diversity in situ, which suggests that physiological abilities associated with osmotrophy can compensate for light limitation and maintain high natural species diversity in less nutrient polluted shallow lakes.
Additionally, our study investigated how non-limiting conditions may change taxonomic composition. Resource-based competition theory predicts that mixotrophy only supports higher fitness under limitation of the primary organism's resource (light, nutrient or an external carbon source) (Rothhaupt, 1996; Boëchat et al., 2007). However, consequences of ‘mixotrophy’ under non-limiting conditions, i.e. the community's use of both organic carbon and light as resources with the possible coexistence of protists occurring at both ends of the light-organic carbon resource use spectrum, have rarely been studied. Except for the Azul Lake, final diversity supported by L + N + OC conditions (designed to favor mixotrophic species) did not differ from that observed for L + N conditions, although assemblage composition and species richness tended to differ between both experimental conditions. This result suggests that changes in environmental conditions could lead to changes in community composition and species richness, without concomitant changes in community diversity. Consequently, the role of each phytoplankton species and the entire phytoplankton community in whole-lake matter cycling may be a more important question than predicting the final diversity of eutrophic tropical lakes. Analyzing changes in phytoplankton functional groups may be an interesting approach to investigate eutrophication effects in tropical lake phytoplankton communities (Reynolds et al., 2002).
In conclusion, the extreme conditions applied in the experimental setup limit direct extrapolation of our results to natural community processes during eutrophication and should be interpreted with caution. Nonetheless, our results are consistent with previous studies and suggest significant declines in diversity and species richness during eutrophication in tropical lakes (Figueredo and Giani, 2001), a response already described for temperate lakes (Sommer, 1988, 1991; Ptacnik et al., 2008). The comparison of succession outcomes among different growth conditions in our study is a new approach that analyses the role of different physiological abilities of phytoplankton species in population dynamics as succession advances. Population dynamics resulted in species substitution as a response to experimental eutrophication, rather than in co-existence and dominance of better-adapted species. Our results suggest that diversity and richness declines are especially severe at later light-limited eutrophication stages. In simulated late, i.e. heterotrophic, eutrophication stages, the chlorophyte Chlamydomonas sp. 1 dominated the phytoplankton assemblages of four of the five tropical lakes investigated. Earlier experimental eutrophication stages, simulated by conditions favoring autotrophy and mixotrophy, did not differ in species diversity, but assemblage composition and species richness differed between both conditions, pointing to a changing role of the phytoplankton community in whole-lake ecosystem processes already in early eutrophication stages.
FUNDING
This work was supported by a fellowship to E.M.S. by the Conselho Nacional de Desenvolvimento Científico e Tecnológico (CNPq).
ACKNOWLEDGMENTS
We would like to thank A. Contin, F.L. Nascimento, A.T.B. Santos, R.C. Chaves, A.B.M. Paiva, A.P.C. Carvalho, G.C. Silva and R.C.S. Silva for their help with field sampling and maintenance of protist cultures during the experiments. Three anonymous reviewers provided helpful and constructive comments on an earlier version of this manuscript. A. Giani facilitated phytoplankton counting by granting access to her lab and microscopes.
REFERENCES
Author notes
Corresponding editor: Beatrix E. Beisner
